400-8006-805


| Features | Feature Description |
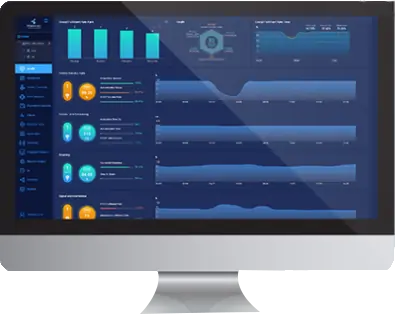
| Network multi-dimensional state visible, the user's whole journey experience perception | Based on the network health view overlay to present KPI indicator data, provide real-time monitoring, historical backtracking two monitoring capabilities, operation and maintenance personnel can |
| Set thresholds for key monitoring indicators and objects to intuitively feel whether network KPI indicators deteriorate. | |
| Based on the historical network data reported by the devices, the devices that need to save energy and the energy saving period are intelligently calculated and controlled by the controller | |
| You can power on and power off AP devices and view power consumption in network health view. | |
| Supports multi-dimensional statistical views based on hierarchical areas | |
| Supports custom views, and displays key statistics of the network and users through large-screen wheel casting | |
| You can view network access problems, network congestion problems, device status problems, and network packet errors from the building perspective | |
| Support building perspective combined with wired and wireless health problems, network problems are simple and concise and visible | |
| Support user retrieval based on the building perspective, and present the building information passed by the user in a period of time | |
| Import topologies and plan AP points to visually view fault distribution based on location | |
| It automatically discovers the topology corresponding to the physical network, displays network information in the topology view, and visually monitors the entire network in real time | |
| View the RF heat map based on AP points | |
| Import planning data based on network regulations, and compare with actual network operation data to show the difference between planning and actual operation | |
| Supports device portraits to view the health status of switches, aps, and routers | |
| Supports spectrum analysis based on aps, including all-channel status monitoring, Wi-Fi interference sources and non-Wi-Fi interference sources | |
| Support the terminal APP dial test to intuitively understand the advantages and disadvantages of Wi-Fi network experience, real-time generation of multi-vendor network comparison dial test report | |
| Support users to see the whole journey experience, to see who, when, connected to which AP, how the experience, what happened | |
| Support to view the process of a single user access to the network playback, including association, authentication (support 802.1x authentication, Portal authentication, MAC authentication, HACA authentication and PSK authentication), DHCP three stages of the protocol detailed information, including interaction results and time, if the failure to show the specific reasons for failure | |
| Support poor quality user correlation analysis: when the user experience deteriorates, through the KPI similarity analysis algorithm, to identify quantified correlation indicators, effectively improve the identification accuracy of the root cause of the problem | |
| Device management, southbound docking, installation, upgrade, capacity expansion and other service and management plane full stack support IPV6 | |
| Automatic identification of network problems, active prediction | Support automatic identification of common network problems based on big data analysis and machine learning algorithm: connection class, air interface performance class, roaming class, |
| As well as device environment, device capacity, network performance, network status and network protocol problems, including authentication failure, weak signal coverage, non-5G priority, network congestion, etc | |
| Support dynamic baseline-based anomaly detection to identify anomalies in the early stages of network deterioration | |
| Support intelligent analysis of second-level reported data, and establish network health evaluation system from multiple dimensions. Through the comprehensive evaluation of index weights, regional rankings are given to drive the continuous improvement of experience from "poor" to "good", and gradually improve the quality of the entire network. Each indicator can see the comparison between the dynamic baseline of the region and the whole region, and give the radar map of the associated root cause indicators, in-depth root cause analysis. In addition to the comparison analysis at different times or in different regions, the network health analysis report can be sent to the administrator in real time or periodically by email | |
| Intelligently delimit network problems and analyze root causes | Support problem distribution view, view the number of problems occurring on different devices and the number of people affected, and quickly focus on high-incidence devices and problems |
| High incidence period | |
| Support the problem affected analysis view, through multi-dimensional correlation analysis, fast fault demarcation, layer by layer drill root cause | |
| Support accurate root cause analysis and repair suggestions based on rule engine, fast problem closed-loop | |
| Open northbound API interface, providing rich intelligent analysis data | Support according to the characteristics of the data to provide different secondary development capabilities, through the 3 types of interfaces can be the original data and the analysis of the data comprehensive |
| Open to third party systems, including network operation and maintenance systems, IT business systems, etc., to provide more intelligent analysis data. | |
| Northbound API: open resource data (devices, interfaces, links, and boards), health data (health issues, health evaluations), and terminal session data. | |
| SNMP Northbound: Reports alarm data to a third-party system based on SNMP. | |
| Kafka Northbound: Collects CampusInsight-G from Kafka through the Consumer API provided by Kafka | |
| Telemetry data. |
The value-added package is divided into network application analysis value-added package, network tuning self-healing value-added package, energy consumption analysis value-added package, and network wireless location value-added package. The value-added package of network application analysis includes the following functions:
| Features | Feature Description |
| Application visual and flow analysis | Through application recognition technology, accurate identification of 1K+ mainstream applications, including: Teams, Dingding, WebEX, Xiaoyu Yilian, etc |
| Support DPI, DFI, AI application clustering, custom rules and other application identification technology, covering mainstream applications and enterprise private applications | |
| Based on the application, analyze the whole network application traffic/number of users, can play back the user's application usage in the user's journey | |
| Support application traffic statistics restrictions based on interface, device, host and other dimensions: | |
| Supports non-encrypted RTP applications and TCP applications in IPv4 scenarios | |
| This version supports switch, AC (excluding on-board AC), AP V200R021C00 or later. The devices need to enable application identification or NetStream | |
| Application experience perception and quality difference analysis | Support LAN&WAN application integration analysis, support to perceive east-west, North-South TCP, non-encrypted RTP applications and their quality |
| Through the exclusive iPCA 2.0 technology to achieve network quality detection based on real service flow, real-time display of Wi-Fi->LAN->WAN end-to-end real service flow path, including devices at both ends, devices and ports flowing through. And superimpose fault mode analysis on the path, quickly and intelligently delimit to the problem device or port | |
| The iPCA3.0 technology is used to detect the quality of the uplink air network.Restriction Restriction: | |
| Supports non-encrypted RTP applications and TCP applications in IPv4 scenarios | |
| This version supports switch, AC (excluding on-board AC), AP V200R021C00 or later, and the devices need to enable eMDI | |
| And iPCA 2.0 |
The Network Tuning Self-Healing value-added pack contains the following features:
| Features | Feature Description |
| Capacity tuning | · Recommend the best bandwidth by identifying the deployment density of the network · Support predictive big data tuning and tuning revenue presentation |
| Roaming tuning | · Through big data analysis, differentiated roaming guidance is provided for different types of terminals to improve the roaming experience of terminals |
| Coverage tuning | · Improve the terminal's network experience by identifying weak coverageaps in the network and recommending the best power |
| Interference tuning | · Intelligent algorithms are used to identify high-load aps in the network,assess theinterference impact of high-interference aps, and provide decision data distribution In the device tuning phase, refer to the decision data delivered by the analyzer to complete the tuning |
The value-added network energy analysis package includes the following functions:
| Features | Feature Description |
| Energy consumption visible | Based on the power data reported by the device, the energy consumption indicator is presented based on the network health view capability, supporting the overall, site, floor, Device energy consumption visibility |
| Recommended energy saving strategies | Intelligent recommendation of energy saving strategy through tide prediction algorithm Intelligent identification of dumb terminals (printers/IP phones, etc.) to ensure that dumb terminals do not drop online, and can compare energy-saving gains |